01
Management and operations dashboard
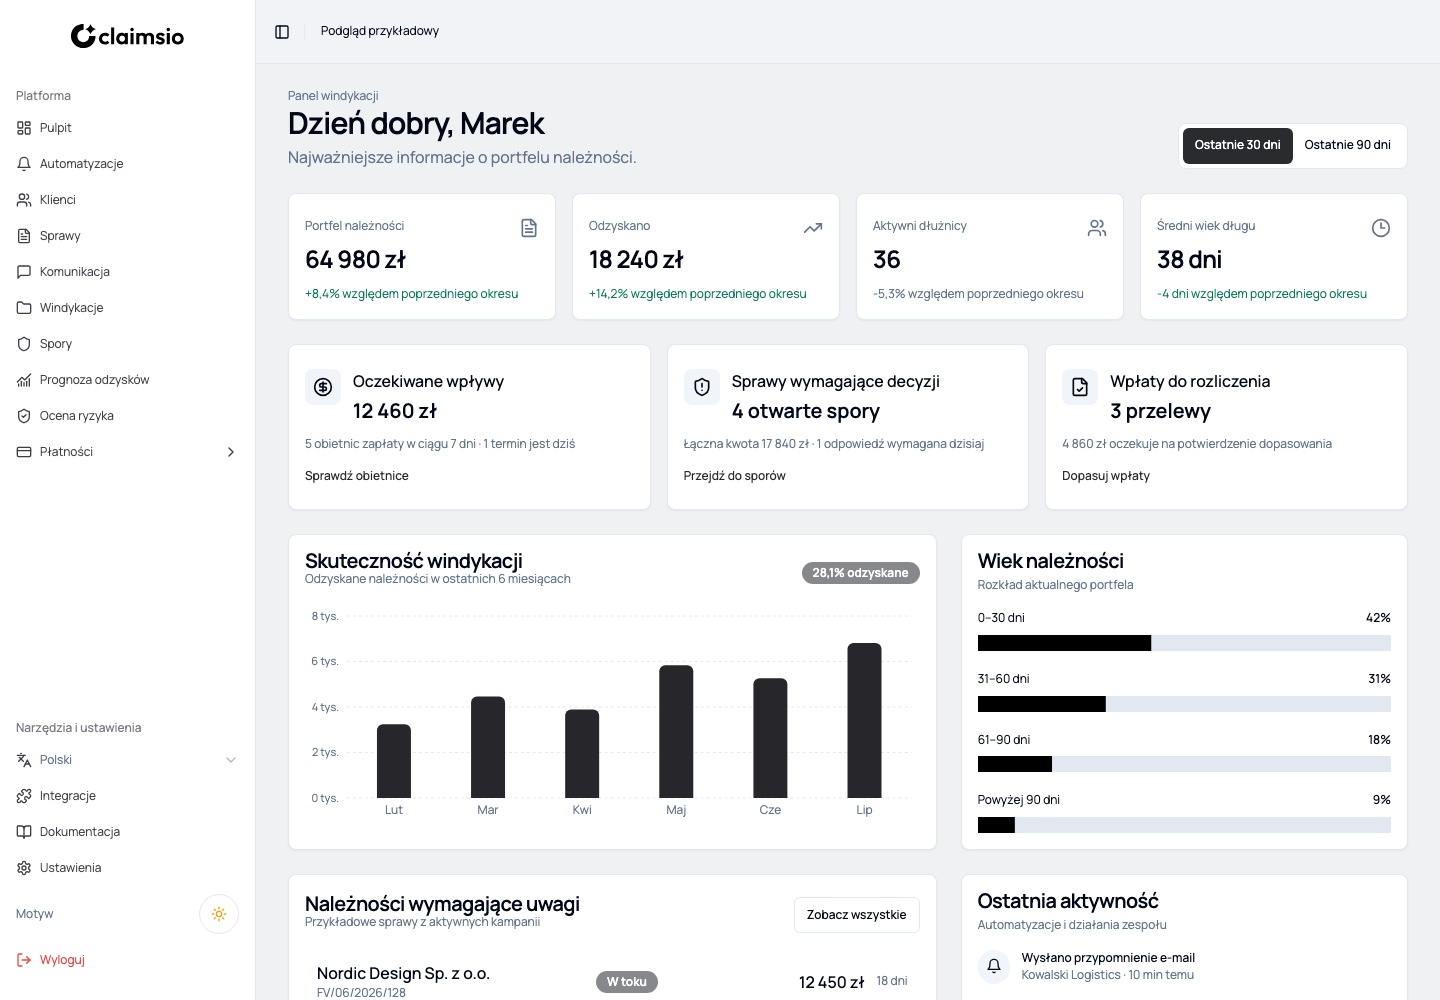
We created a dashboard that summarizes the value of the open portfolio, recovered amounts, active debtors, average debt age, expected inflows and cases requiring a decision. A 30/90-day switch and recovery chart give leaders a current view without assembling reports by hand.
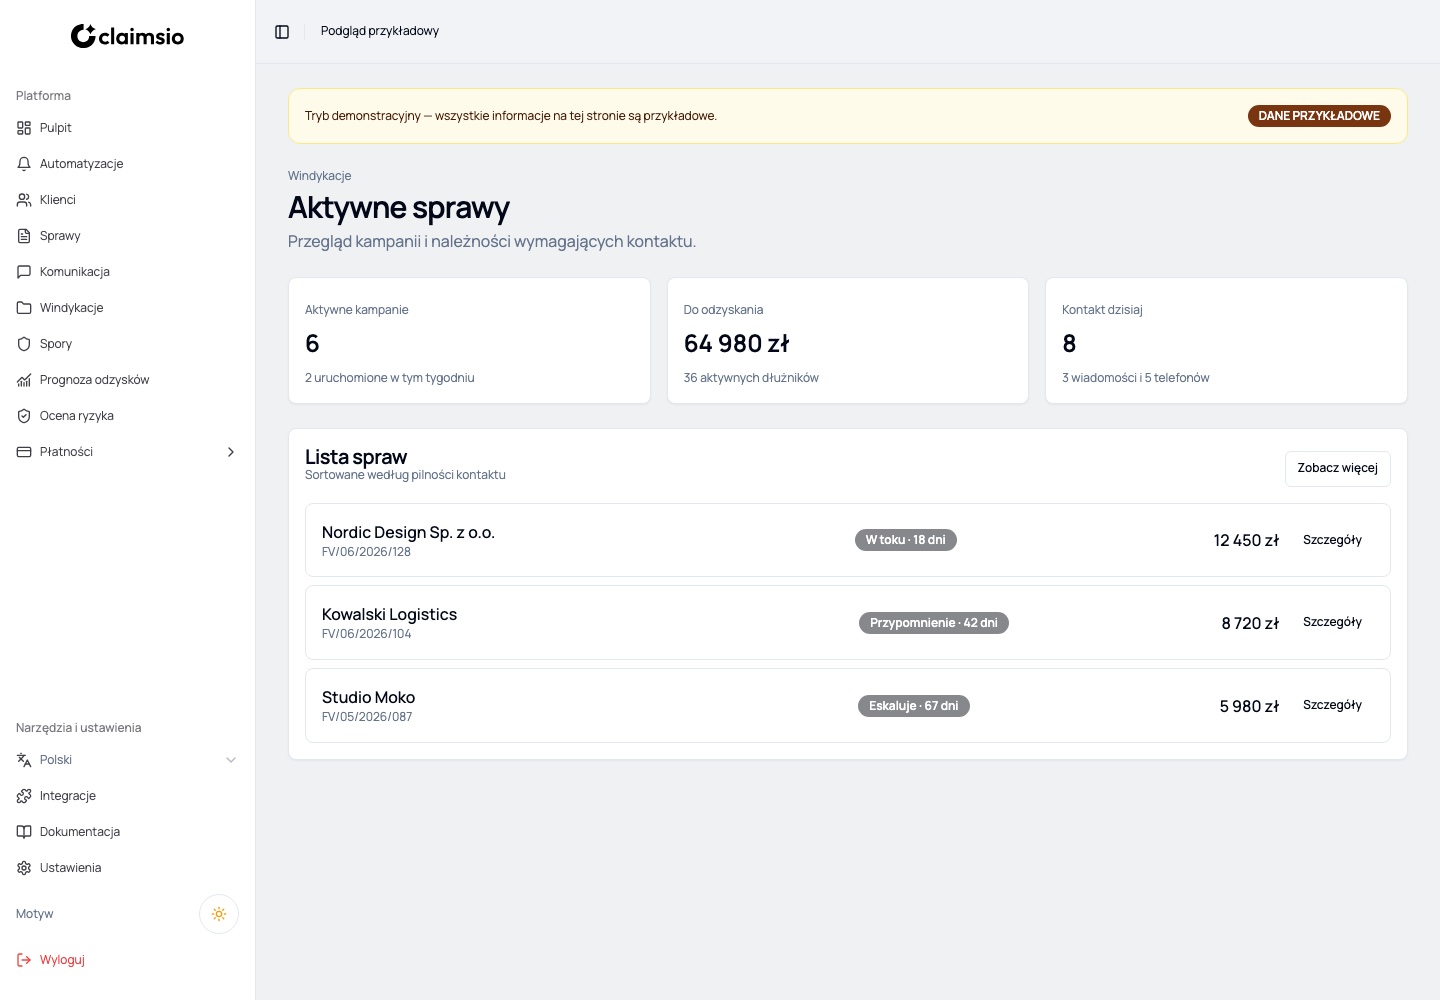
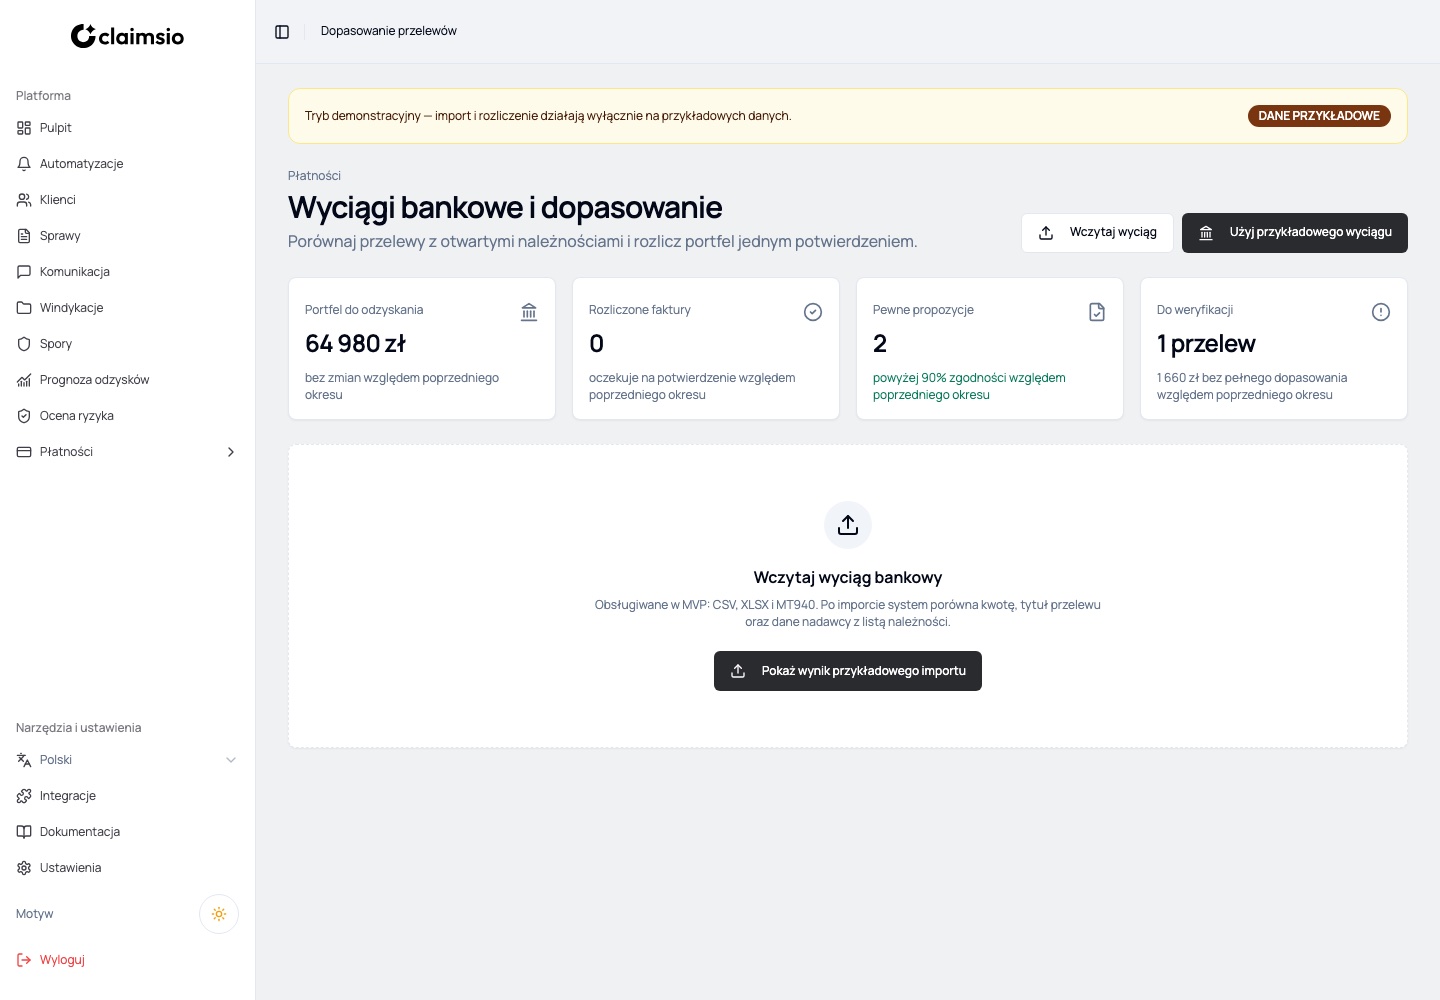
The interface combines management metrics with daily actions. Finance leadership can see risk and cash-flow signals, while the operational team immediately sees promises due, disputes and payments waiting to be matched.
- Portfolio and recovery value
- Active debtors and average debt age
- Expected payments and decision queue
- Monthly recovery performance and aging structure
Business result: faster decisions, fewer manually prepared reports and a shared picture of where money and risk are concentrated.